Users can cross-filter slicers in presentations by defining interactions between slicers, in order to produce a waterfall-like "cascading slicer." Cascading slicers allow you to filter the options in one slicer based on the selection made in a previous slicer. The second slicer dynamically updates to show only the relevant values based on the first selection. For example, you could create a Region slicer and use it to filter a Country slicer so that only those countries in the selected region are shown.
You can create complex cascading slicers containing multiple levels very easily from Discover, Formulate, or here in Present.
Example Overview
The example that we are going to create uses new slicers as a cascading set; where the initial slicer represents countries, the next states, then cities. This allows readers to filter their sales matrix very easily, using dropdown lists with a more manageable number of slices.
Note: You can add existing slicers or cascading slicers built in Discover, but we are going to use the New Slicer tool in Present Pro to add the required slicers on the fly.
Walkthrough Steps
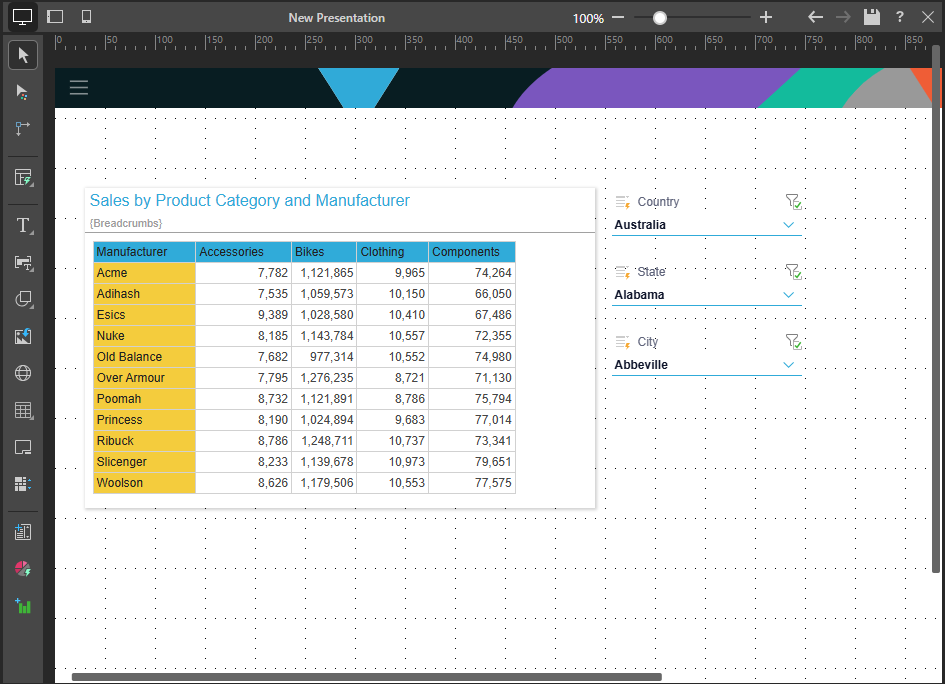
Step 1: Create your Slicers
You can create three slicers using the New Slicer tool, a Country slicer, a State slicer, and a City slicer. These slicers appear on the canvas as follows:
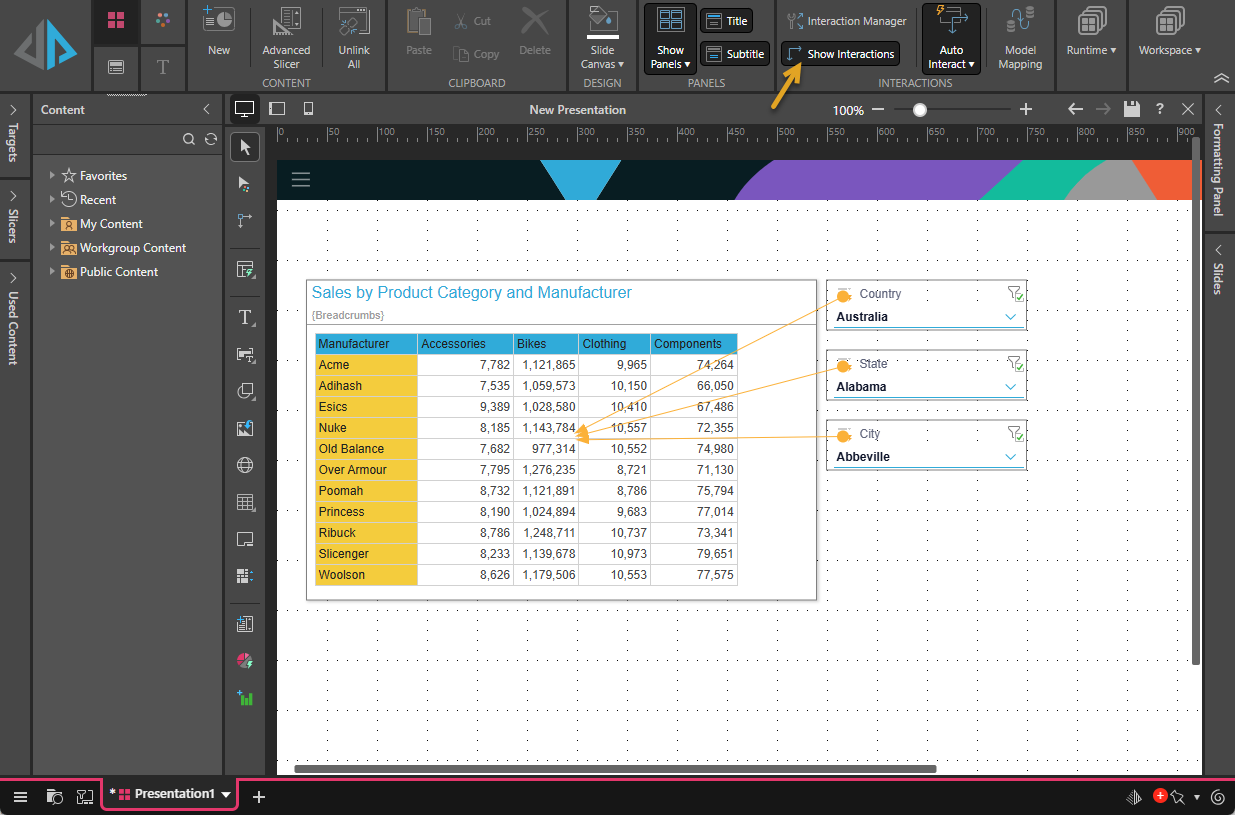
Step 2: Add Interactions
The cascade is not configured automatically. If you click Show Interactions (orange arrow below) on the Home ribbon, you will see the current interaction configuration. Where Auto Interact is enabled, each slicer interacts with the visual but they do not interact with one another:
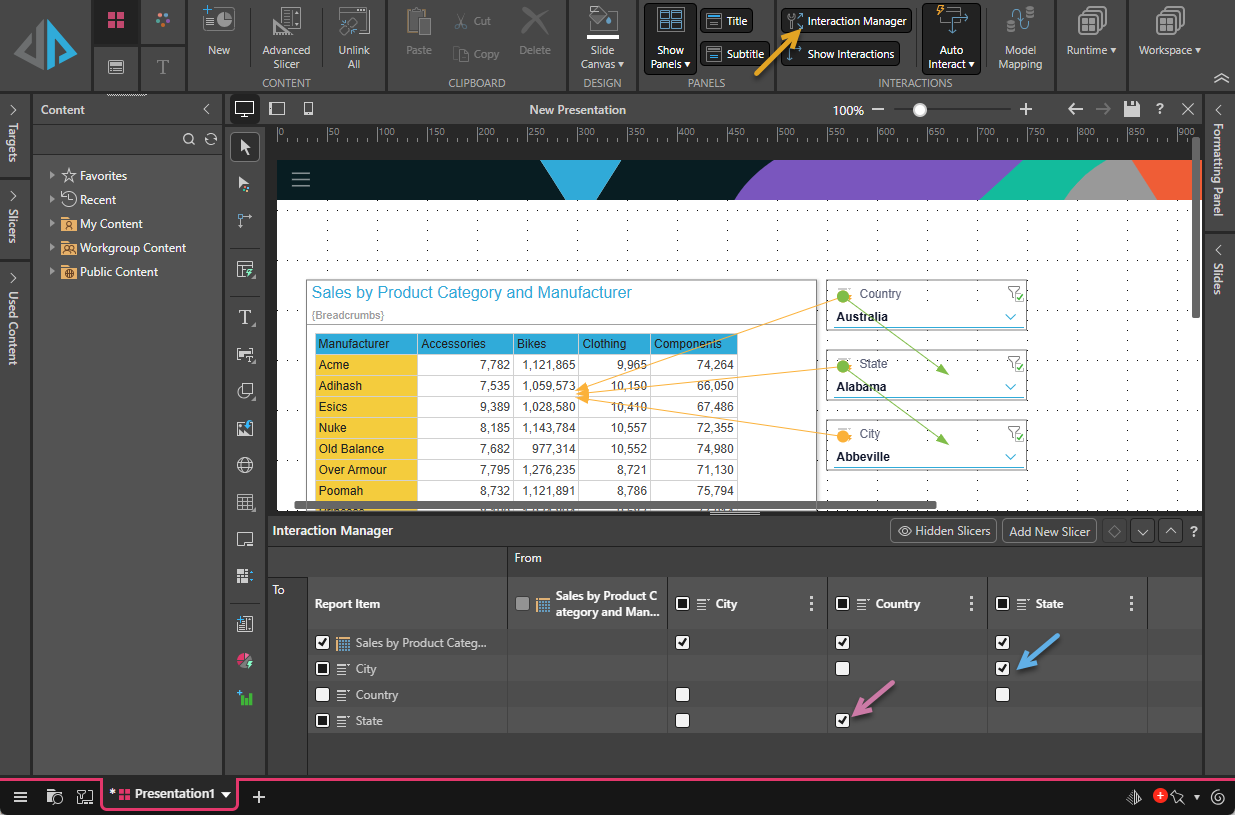
From the Home ribbon, click Interaction Manager (orange arrow below):
- Connect the first-level slicer to the next-level slicer; that is, select the checkbox representing the interaction from Country to State (purple arrow).
- Connect the second-level slicer to the last-level slicer; that is, select the checkbox from State to City (blue arrow).
Note that there are now five arrows showing as interactions on the canvas: three orange arrows indicate that the slicers all target the visual and the two green arrows show the cascading slicer action Country > State > City.
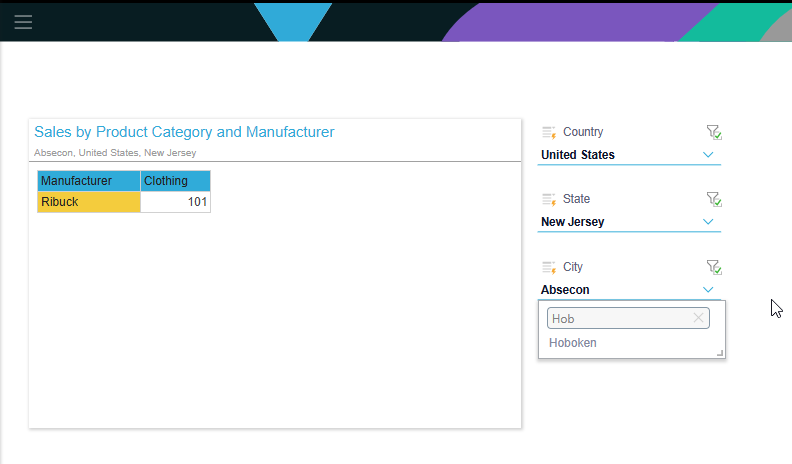
Step 3: Preview your Interactions
From the Home ribbon, click From Beginning to run the presentation and preview your slicer interactions: